2024 Water Quality Report
Our Water Quality Report is released annually in June.
Click here to download a PDF. To request a copy by mail, please call (910) 223-4009.
Meeting Standards. Surpassing Expectations.
At PWC, we care deeply about the quality of the water we provide for our customers, and we’re proud of the exceptional standards we maintain. Each year we publish a “Water Quality Report” with the results of testing we are required to perform.
However, we don’t test our water just because we “have to.” It’s part of our unparalleled commitment to provide you with the highest quality drinking water that meets and surpasses regulatory requirements.
Above and Beyond
PWC is proud to be a charter member of the national Partnership for Safe Water. We were the first utility in North Carolina to earn the Environmental Protection Agency (EPA) Director’s Award for water treatment, recognizing our extra efforts in providing clean and safe drinking water that exceeds federal drinking water standards. PWC has received this prestigious recognition for 24 consecutive years.
In 2011, PWC became a charter member of the Partnership for Safe Water Distribution System Optimization Program. This program focuses on the operation and maintenance of water treatment facilities, water mains and storage tanks. In 2014, when we completed the 18-month self-assessment phase of the program, we were among the first utilities in the country to be recognized for this achievement.
In 2024, PWC was recognized with the Gold Award for Exceptional Utility Performance by the Association of Metropolitan Water Agencies. PWC was one of five utilities in the nation recognized for this prestigious award in 2024.
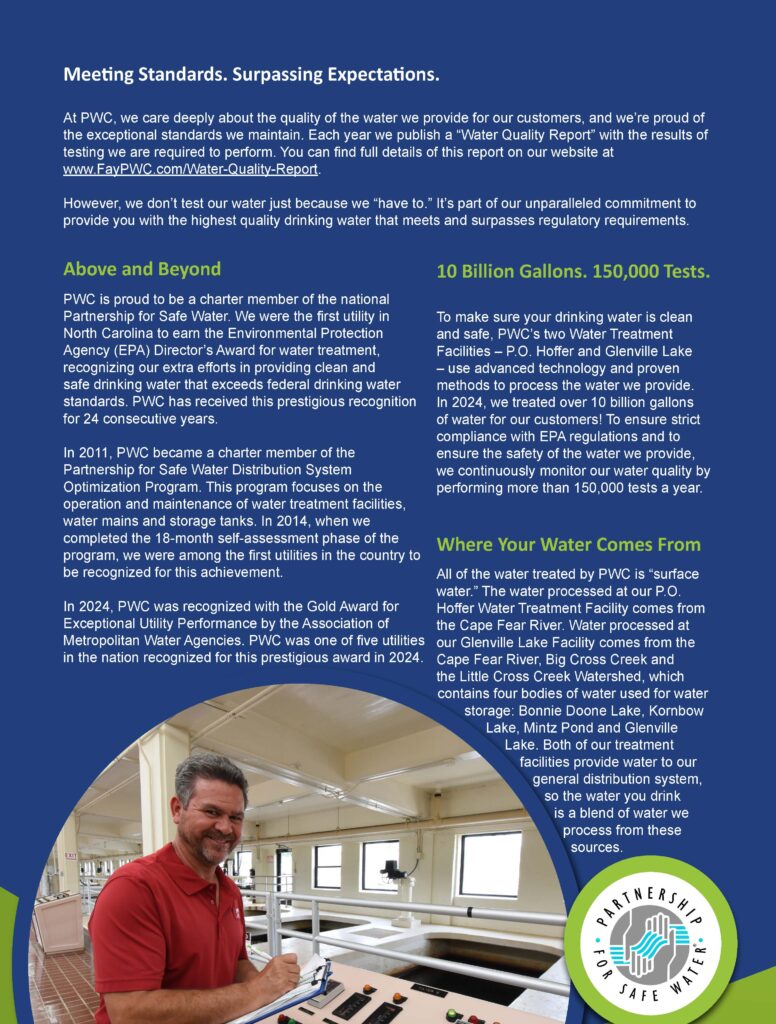
10 Billion Gallons. 150,000 Tests.
To make sure your drinking water is clean and safe, PWC’s two Water Treatment Facilities – P.O. Hoffer and Glenville Lake – use advanced technology and proven methods to process the water we provide. In 2024, we treated over 10 billion gallons of water for our customers! To ensure strict compliance with EPA regulations and to ensure the safety of the water we provide, we continuously monitor our water quality by performing more than 150,000 tests a year.
Where Your Water Comes From
All of the water treated by PWC is “surface water.” The water processed at our P.O. Hoffer Water Treatment Facility comes from the Cape Fear River. Water processed at our Glenville Lake Facility comes from the Cape Fear River, Big Cross Creek and the Little Cross Creek Watershed, which contains four bodies of water used for water storage: Bonnie Doone Lake, Kornbow Lake, Mintz Pond and Glenville Lake. Both of our treatment facilities provide water to our general distribution system, so the water you drink is a blend of water we process from these sources.
How is Your Water Treated?
While the treatment process varies slightly at our two water treatment facilities, the basic steps are similar.
The Disinfection Method
PWC uses chloramination as our main disinfectant. Chloramine inactivates and prevents pathogen growth in our system by utilizing both ammonia and chlorine. Ammonia is added to the water at a carefully controlled level, and the chlorine and ammonia react chemically to produce chloramines. This method inactivates the COVID-19 virus, as well as other coronaviruses.
Chloraminated water is perfectly safe for drinking, cooking, bathing and other daily water uses. There are, however, two groups of people who need to take special care with chloraminated water: customers who use drinking water for kidney dialysis machines and fish owners. For more information on chloramination, including special precautions these special groups should take, contact PWC. As an extra measure of safety, the North Carolina Department of Environmental Quality (NCDEQ) requires all water systems using chloramination to suspend the addition of ammonia for a one-month period each year. We do this each March to prevent any biological growth and nitrification from occurring in the water distribution system.
The Treatment Process
PWC operations and maintenance staff at our facilities are committed to providing safe, high quality drinking water for our customers. When raw surface water enters the facility, ferric sulfate is added, causing small particles to adhere to one another. This makes the particles heavy enough to settle out of the water in a sedimentation basin. The water is then filtered through sand and anthracite to remove any remaining fine particles. Ammonia and chlorine are added to kill harmful bacteria, protozoans and viruses. Lime or caustic soda and a corrosion inhibitor are added to minimize the potential for dissolving the lead solder used on copper piping in older household plumbing. Fluoride is added as an aid in preventing tooth decay. Both facilities also add powdered activated carbon to reduce substances that produce unpleasant tastes and odors. Treated water proceeds through a series of pumps and storage facilities before being delivered to your home.
An Extra Measure of Concern
As noted above, PWC adds fluoride to your water supply. Proven as a safe and healthy way to effectively prevent tooth decay, community water fluoridation has been recognized by the U.S. Centers for Disease Control (CDC) as one of ten great public health achievements of the 20th century.
Our Water Meets or Surpasses All EPA Standards
PWC annually tests for 118 elements and contaminants regulated by the EPA and meets or surpasses all the standard requirements annually. Your drinking water, including bottled water, may reasonably be expected to contain small amounts of some contaminants. However, the presence of contaminants does not necessarily indicate that water poses a health risk.
We understand that reports of contaminants in local water sources cause concerns about the safety of our drinking water. We share that concern about PFAS as PWC’s top priority is providing safe, high-quality drinking water that meets or exceeds all current regulatory standards.
The reports of GenX being discharged into the Cape Fear River are below the PWC/Fayetteville water service area and more than 20 miles downstream of where we take water from the river to treat. However, instances of GenX and other Per- and polyfluoroalkyl substances (PFAS) have been found in our sampling.
It has been well reported that the predominant source of emerging compounds is the use of/and manufacturing of products including cosmetics, shampoos, paints, food packaging, cleaning, stain and stick resistance products.
Prior to the EPA announcing proposed PFAS drinking water standards in 2023, there had been no established regulatory limits for PFAS in drinking water. However, for nearly 10 years, PWC has advocated with regulatory agencies to reduce and prevent the discharge of industrial pollution/PFAS into the Cape Fear River, our primary drinking water source. While PFAS are present in our source water, the EPA says 70% of a consumer’s exposure to emerging compounds comes from non-drinking water sources.
We understand the public’s desire for swift action to remove PFAS and we have a planned water treatment upgrade to Granular Activated Carbon (GAC) which has been studied at our plants and determined to be the most effective method for PWC. It is important to know that any water treatment upgrade is a major infrastructure investment and upgrades must be made for each of our drinking water plants.
As this upgrade is being designed and built to help us meet new EPA Drinking Water standards, we have been actively working to upgrade our current Powder Activated Carbon (PAC) treatment capabilities to allow a higher dosage than is currently possible. While PAC is not as efficient or economical as GAC, it can effectively remove modest amounts of PFAS and it will assist us in addressing PFAS until GAC, which is the best solution, can be installed.
PAC construction begins this spring and is expected to be completed by April 2026. Our GAC upgrade is expected to be operational by February 2028.
PWC’s top priority will continue to be providing safe, high-quality drinking water and we are committed to continued advocacy to prevent PFAS from being discharged into our source water so that we can eliminate the exposure and financial burden for our customers.
Some people may be more vulnerable to contaminants in drinking water than the general population. Immuno-compromised persons such as those with cancer undergoing chemotherapy, organ transplant recipients, people with HIV/AIDS or other immune system disorders, some elderly, and infants can be particularly vulnerable to infections. These people should seek advice about drinking water from their health care providers.
More information on PFAS, including monthly PWC testing results, can be found on our website:
www.FayPWC.com/PFAS-Facts/
Operation Clean & Clear-Protecting You From Lead Exposure
If present in drinking water, elevated levels of lead can cause serious health problems, especially for pregnant women and young children. Lead in drinking water is primarily from materials and components associated with service lines and home plumbing.
PWC is committed to delivering safe water to our customers. The water we provide to homes and businesses is lead-free. While our water is lead-free, that doesn’t mean there may not be lead lines/plumbing in the system.
Copper piping with lead solder as well as lead service lines are more likely to be found in homes built before 1986. Among homes without lead service lines, brass or chrome-plated brass faucets may also create lead exposure.
Since 1991, PWC has participated in the lead and copper sampling program as required by the Safe Drinking Water Act (SDWA). As a result, PWC implemented a corrosion control program to stop lead from the pipes and fixtures from entering the water system. This corrosion control program has been successful in that all PWC’s samples are well below the EPA mandated thresholds for lead in drinking water, including our most recent testing in 2023.
In 2022, PWC began Operation Clean and Clear, a project that helps us continue protecting our customers from lead exposure by identifying the material used in all water service lines – those maintained by PWC and customers’ service lines connected to our water mains.
Based on records and knowledge of our system, we anticipate there to be no or minimal instances of lead service lines, but we will be documenting all locations.
To learn more about Operation Clean and Clear and to view our online service line inventory, visit, www.FayPWC.com/Operation-Clean-Clear/
If you are concerned about lead in your water, information on lead in drinking water, testing methods, steps you can take to minimize exposure and additional information are available from the Safe Drinking Water Hotline (800-426-4791) or at EPA.gov/Safewater/Lead.
For PWC’s full annual water quality report, visit FayPWC.com/Water-Quality-Report
More information about contaminants and potential health effects can be obtained by calling the EPA’s Safe Drinking Water Hotline (800-426-4791).
2024 Annual Drinking Water Quality Report
Fayetteville Public Works Commission
Water System Number: NC 03-26-010
Este informe contiene información muy importante sobre su agua potable. Tradúzcalo o hable con alguien que lo entienda bien.
We are pleased to present to you this year’s Annual Drinking Water Quality Report. This report is a snapshot of last year’s water quality. Included are details about your source(s) of water, what it contains, and how it compares to standards set by regulatory agencies. Our constant goal is to provide you with a safe and dependable supply of drinking water. We want you to understand the efforts we make to continually improve the water treatment process and protect our water resources. We are committed to ensuring the quality of your water and to providing you with this information because informed customers are our best allies. If you have any questions about this report or concerning your water, please contact Jason Green at (910) 223-4710. We want our valued customers to be informed about their water utility. If you want to learn more, please attend any of our regularly scheduled commission meetings. They are held at 955 Old Wilmington Drive on the second and fourth Wednesday of each month, starting at 8:30 a.m.
What EPA Wants You to Know
Drinking water, including bottled water, may reasonably be expected to contain at least small amounts of some contaminants. The presence of contaminants does not necessarily indicate that water poses a health risk. More information about contaminants and potential health effects can be obtained by calling the Environmental Protection Agency’s Safe Drinking Water Hotline (800-426-4791).
Some people may be more vulnerable to contaminants in drinking water than the general population. Immuno-compromised persons such as persons with cancer undergoing chemotherapy, persons who have undergone organ transplants, people with HIV/AIDS or other immune system disorders, some elderly, and infants can be particularly at risk from infections. These people should seek advice about drinking water from their health care providers. EPA/CDC guidelines on appropriate means to lessen the risk of infection by Cryptosporidium and other microbial contaminants are available from the Safe Drinking Water Hotline (800-426-4791).
The sources of drinking water (both tap water and bottled water) include rivers, lakes, streams, ponds, reservoirs, springs, and wells. As water travels over the surface of the land or through the ground, it dissolves naturally occurring minerals and, in some cases, radioactive material, and can pick up substances resulting from the presence of animals or from human activity. Contaminants that may be present in source water include microbial contaminants, such as viruses and bacteria, which may come from sewage treatment plants, septic systems, agricultural livestock operations, and wildlife; inorganic contaminants, such as salts and metals, which can be naturally-occurring or result from urban stormwater runoff, industrial or domestic wastewater discharges, oil and gas production, mining, or farming; pesticides and herbicides, which may come from a variety of sources such as agriculture, urban stormwater runoff, and residential uses; organic chemical contaminants, including synthetic and volatile organic chemicals, which are by-products of industrial processes and petroleum production, and can also come from gas stations, urban stormwater runoff, and septic systems; and radioactive contaminants, which can be naturally-occurring or be the result of oil and gas production and mining activities.
In order to ensure that tap water is safe to drink, EPA prescribes regulations which limit the amount of certain contaminants in water provided by public water systems. FDA regulations establish limits for contaminants in bottled water, which must provide the same protection for public health.
When You Turn on Your Tap, Consider the Source
The Cape Fear River and the Little Cross Creek watershed are the source waters of our system. The P.O. Hoffer Facility is found at 508 Hoffer Drive and the Glenville Lake Facility is located at 628 Filter Plant Drive.
Source Water Assessment Program (SWAP) Results
The North Carolina Department of Environmental Quality (DEQ), Public Water Supply (PWS) Section, Source Water Assessment Program (SWAP) conducted assessments for all drinking water sources across North Carolina. The purpose of the assessments was to determine the susceptibility of each drinking water source (well or surface water intake) to Potential Contaminant Sources (PCSs). The results of the assessment are available in SWAP Assessment Reports that include maps, background information and a relative susceptibility rating of Higher, Moderate or Lower.
The relative susceptibility rating of each source for Fayetteville Public Works Commission was determined by combining the contaminant rating (number and location of PCSs within the assessment area) and the inherent vulnerability rating (i.e., characteristics or existing conditions of the well or watershed and its delineated assessment area). The assessment findings are summarized in the table below:
Susceptibility of Sources to Potential Contaminant Sources (PCSs)
| Source Name | Susceptibility Rating | SWAP Report Date |
| Cape Fear River | Higher | September 2020 |
| Glenville Lake | Higher | September 2020 |
Surface Water Source Information
| Source Name | Watershed Classification | Source Location |
| Cape Fear River | WS-IV | Direct Stream |
| Glenville Lake | WS-IV | Class I |
The complete SWAP Assessment report for Fayetteville Public Works Commission may be viewed on the Web at: https://www.ncwater.org/?page=600 Note that because SWAP results and reports are periodically updated by the PWS Section, the results available on this website may differ from the results that were available at the time this CCR was prepared. If you are unable to access your SWAP report on the web, you may mail a written request for a printed copy to: Source Water Assessment Program – Report Request, 1634 Mail Service Center, Raleigh, NC 27699-1634, or email requests to swap@deq.nc.gov. Please indicate your system name, number, and provide your name, mailing address and phone number. If you have any questions about the SWAP report, please contact the Source Water Assessment staff by phone at (919) 707-9098.
It is important to understand that a susceptibility rating of “higher” does not imply poor water quality, only the system’s potential to become contaminated by PCSs in the assessment area.
Help Protect Your Source Water
Protection of drinking water is everyone’s responsibility. We have a robust and proactive watershed management program that helps protect our valuable water resources. Please visit https://www.faypwc.com/watershed-protection for more information. You can help protect your community’s drinking water sources in several ways: by disposing of chemicals properly; taking used motor oil to a recycling center, volunteering in your community to take part in group efforts to protect your source, etc.).
Important Drinking Water Definitions:
Important Drinking Water Definitions:
- Not-Applicable (N/A) – Information not applicable/not required for that particular water system or for that particular rule.
- Non-Detects (ND) – Laboratory analysis indicates that the contaminant is not present at the level of detection set for the particular methodology used.
- Parts per million (ppm) or Milligrams per liter (mg/L) – One part per million corresponds to one minute in two years or a single penny in $10,000.
- Parts per billion (ppb) or Micrograms per liter (ug/L) – One part per billion corresponds to one minute in 2,000 years, or a single penny in $10,000,000.
- Parts per trillion (ppt) or Nanograms per liter (nanograms/L) – One part per trillion corresponds to one minute in 2,000,000 years, or a single penny in $10,000,000,000.
- Parts per quadrillion (ppq) or Picograms per liter (picograms/L) – One part per quadrillion corresponds to one minute in 2,000,000,000 years or one penny in $10,000,000,000,000.
- Picocuries per liter (pCi/L) – Picocuries per liter is a measure of the radioactivity in water.
- Million Fibers per Liter (MFL) – Million fibers per liter is a measure of the presence of asbestos fibers that are longer than 10 micrometers.
- Nephelometric Turbidity Unit (NTU) – Nephelometric turbidity unit is a measure of the clarity of water. Turbidity in excess of 5 NTU is just noticeable to the average person.
- Variances and Exceptions – State or EPA permission not to meet an MCL or Treatment Technique under certain conditions.
- Action Level (AL) – The concentration of a contaminant which, if exceeded, triggers treatment or other requirements which a water system must follow.
- Treatment Technique (TT) – A required process intended to reduce the level of a contaminant in drinking water.
- Maximum Residual Disinfection Level (MRDL) – The highest level of a disinfectant allowed in drinking water. There is convincing evidence that addition of a disinfectant is necessary for control of microbial contaminants.
- Maximum Residual Disinfection Level Goal (MRDLG) – The level of a drinking water disinfectant below which there is no known or expected risk to health. MRDLGs do not reflect the benefits of the use of disinfectants to control microbial contaminants.
- Locational Running Annual Average (LRAA) – The average of sample analytical results for samples taken at a particular monitoring location during the previous four calendar quarters under the Stage 2 Disinfectants and Disinfection Byproducts Rule.
- Running Annual Average (RAA) – The average of sample analytical results for samples taken during the previous four calendar quarters.
- Level 1 Assessment – A Level 1 assessment is a study of the water system to identify potential problems and determine (if possible) why total coliform bacteria have been found in our water system.
- Level 2 Assessment – A Level 2 assessment is a very detailed study of the water system to identify potential problems and determine (if possible) why an E. coli MCL violation has occurred and/or why total coliform bacteria have been found in our water system on multiple occasions.
- Maximum Contaminant Level (MCL) – The highest level of a contaminant that is allowed in drinking water. MCLs are set as close to the MCLGs as feasible using the best available treatment technology.
- Maximum Contaminant Level Goal (MCLG) – The level of a contaminant in drinking water below which there is no known or expected risk to health. MCLGs allow for a margin of safety.
Water Quality Data Tables of Detected Contaminants
We routinely monitor for over 150 contaminants in your drinking water according to Federal and State laws. The tables below list all the drinking water contaminants that we detected in the last round of sampling for each contaminant group. The presence of contaminants does not necessarily indicate that water poses a health risk. Unless otherwise noted, the data presented in this table is from testing done January 1 through December 31, 2024. The EPA and the State allow us to monitor for certain contaminants less than once per year because the concentrations of these contaminants are not expected to vary significantly from year to year. Some of the data, though representative of the water quality, is more than one year old.
Lead and Copper Contaminants
| Contaminant (units) | Sample Date | Your Water (90th Percentile) | Number of sites found above the AL | Range Low High | MCLG | AL | Likely Source of Contamination |
| Copper (ppm) (90th percentile) | 6/13/2023 | ND | 0 | ND – 0.105 | 1.3 | AL=1.3 | Corrosion of household plumbing systems; erosion of natural deposits |
| Lead (ppb) (90th percentile) | 6/13/2023 | ND | 0 | All sites were ND | 0 | AL=15 | Corrosion of household plumbing systems; erosion of natural deposits |
The table above summarizes our most recent lead and copper tap sampling data. If you would like to review the complete lead tap sampling data, please email us at jason.green@faypwc.com.
We have been working to identify service line materials throughout the water system and prepared an inventory of all service lines in our water system. To access this inventory, please visit our Project Clean and Clear website at https://www.faypwc.com/operation-clean-clear/
Lead can cause serious health problems, especially for pregnant women and young children. Lead in drinking water is primarily from materials and components associated with service lines and home plumbing. Fayetteville PWC is responsible for providing high quality drinking water and removing lead pipes but cannot control the variety of materials used in plumbing components in your home. You share the responsibility for protecting yourself and your family from the lead in your home plumbing. You can take responsibility by identifying and removing lead materials within your home plumbing and taking steps to reduce your family’s risk. Before drinking tap water, flush your pipes for several minutes by running your tap, taking a shower, doing laundry or a load of dishes. You can also use a filter certified by an American National Standards Institute accredited certifier to reduce lead in drinking water. If you are concerned about lead in your water and wish to have your water tested, contact Fayetteville PWC Customer Service at (910) 483-1382. Information on lead in drinking water, testing methods, and steps you can take to minimize exposure is available at http://www.epa.gov/safewater/lead.
Total Trihalomethanes (TTHM) and Haloacetic Acids (five) (HAA5)
| Disinfection Byproduct | Year Sampled | MCL Violation Y/N | Your Water | Range Low High | MCLG | MCL | Likely Source of Contamination |
| TTHM (ppb) | 2024 | N | 49 | 26-83 | N/A | 80 | Byproduct of drinking water disinfection |
| HAA5 (ppb) | 2024 | N | 31 | 17-54 | N/A | 60 | Byproduct of drinking water disinfection |
Disinfectant Residuals Summary
| Disinfectant (units) | MRDL Violation Y/N | Your Water (RAA) | Range Low High | MRDLG | MRDL | Likely Source of Contamination |
| Chlorine (ppm) | N | 2.03 | 1.70 – 2.29 | 4 | 4.0 | Water additive used to control microbes |
| Chloramines (ppm) | N | 2.83 | 1.61 – 3.23 | 4 | 4.0 | Water additive used to control microbes |
Inorganic Contaminants
| Contaminant (units) | Sample Date | MCL Violation Y/N | Your Water | Range Low High | MCLG | MCL | Likely Source of Contamination |
| Fluoride (ppm) | 2024 | N | 0.57 | 0.32 – 0.99 | 4 | 4 | Erosion of natural deposits; water additive which promotes strong teeth; discharge from fertilizer and aluminum factories |
Nitrate/Nitrite Contaminants
| Contaminant (units) | Sample Date | MCL Violation Y/N | Your Water | Range Low High | MCLG | MCL | Likely Source of Contamination |
| Nitrate (as Nitrogen) (ppm) | 1/10/24 | N | ND | ND | 10 | 10 | Runoff from fertilizer use; leaching from septic tanks, sewage; erosion of natural deposits |
| Nitrite (as Nitrogen) (ppm) | 1/10/24 | N | ND | ND | 1 | 1 | Runoff from fertilizer use; leaching from septic tanks, sewage; erosion of natural deposits |
Turbidity*
| Contaminant (units) | Treatment Technique (TT) Violation Y/N | Your Water | MCLG | Treatment Technique (TT) Violation if: | Likely Source of Contamination |
| Turbidity (NTU) – Highest single turbidity measurement | N | 0.280 NTU | N/A | Turbidity > 1 NTU | Soil runoff |
| Turbidity (%) – Lowest monthly percentage (%) of samples meeting turbidity limits | N | 100% | N/A | Less than 95% of monthly turbidity measurements are < 0.3 NTU |
* Turbidity is a measure of the cloudiness of the water. We monitor it because it is a good indicator of the effectiveness of our filtration system. The turbidity rule requires that 95% or more of the monthly samples must be less than or equal to 0.3 NTU.
Total Organic Carbon (TOC)
| Contaminant (units) | TT Violation Y/N | Your Water (lowest RAA) | Range Monthly Removal Ratio Low – High | MCLG | Treatment Technique (TT) violation if: | Likely Source of Contamination |
| Total Organic Carbon (TOC) Removal Ratio (no units) | N | 1.38 | 1.41 – 1.59 | N/A | Removal Ratio RAA <1.00 and alternative compliance criteria was not met | Naturally present in the environment |
Microbiological Contaminants in the Distribution System
| Contaminant (units) | MCL Violation Y/N | Number of Positive/Present Samples | MCLG | MCL | Likely Source of Contamination |
| E. coli (presence or absence) | N | 0 | 0 | Routine and repeat samples are total coliform-positive and either is E. coli-positive or system fails to take repeat samples following E. coli-positive routine sample or system fails to analyze total coliform-positive repeat sample for E. coli Note: If either an original routine sample and/or its repeat samples(s) are E. coli positive, a Tier 1 violation exists. | Human and animal fecal waste |
Microbiological Contaminants in the Source Water
| Fecal Indicator | Number of “Positive/Present” Samples | Date(s) of fecal indicator-positive source water samples | Source of fecal contamination, if known | Significant Deficiency Cited by the State? Y/N | MCLG | MCL | Likely Source of Contamination |
| E. coli, (presence or absence) | 365 | 1/1 – 12/31 | Runoff, Upstream Dischargers | N | 0 | 0 | Human and animal fecal waste |
| enterococci or coliphage (presence or absence) | 365 | 1/1 – 12/31 | Runoff, Upstream Dischargers | N | N/A | TT | Human and animal fecal waste |
Cryptosporidium
Our system monitored for Cryptosporidium and found levels of 0.09 oocysts/liter in April 2017. In 2017, the highest concentration found in the Cape Fear River was 0.09 oocysts/liter in April of that year.
Cryptosporidium is a microbial pathogen found in surface water throughout the U.S. Although filtration removes Cryptosporidium, the most commonly used filtration methods cannot guarantee 100 percent removal. Our monitoring indicates the presence of these organisms in our source water and/or finished water. Current test methods do not allow us to determine if the organisms are dead or if they can cause disease. Ingestion of Cryptosporidium may cause cryptosporidiosis, an abdominal infection. Symptoms of infection include nausea, diarrhea, and abdominal cramps. Most healthy individuals can overcome the disease within a few weeks. However, immuno-compromised people, infants and small children, and the elderly are at greater risk of developing life-threatening illness. We encourage immuno-compromised individuals to consult their doctor regarding appropriate precautions to take to avoid infection. Cryptosporidium must be ingested to cause disease, and it may be spread through means other than drinking water.
Other Miscellaneous Water Characteristics Contaminants
| Contaminant (units) | Sample Date | Your Water | Range Low High | SMCL |
| Sodium (ppm) | 1/10/24 | 29.4 | NA | N/A |
| Sulfate (ppm) | 1/10/24 | 45 | NA | 250 |
| pH | 1/1 – 12/31/24 | 7.8 | 7.2 – 8.7 | 6.5 to 8.5 |
Unregulated Contaminant Monitoring Rule 5 (UCMR 5) Sampling
In compliance with the Unregulated Contaminant Monitoring Rule 5 (UCMR 5), our water quality sampling focused on assessing the presence of unregulated contaminants that may impact public health. This monitoring initiative, mandated by the Environmental Protection Agency (EPA), aims to gather data on specific contaminants to inform future regulatory decisions.
During the sampling period, we collected water samples from designated locations within our distribution system, following standardized procedures to ensure accuracy and reliability. The samples were analyzed for a range of contaminants, including pharmaceuticals, hormones, and other emerging pollutants.
Results from the UCMR 5 sampling will be evaluated to identify any contaminants present and their potential health implications. This proactive approach underscores our commitment to maintaining water quality and protecting community health. We will continue to monitor these parameters and share findings with stakeholders to enhance public awareness and trust in our water supply.
| Contaminant Abbreviation | Contaminate | Minimal Reportable Level (ppb) | Your Water (ppb) |
| PFOS | Perfluorooctanesulfonic acid | 0.004 | 0.004 |
| PFOA | Perfluorooctanoic acid | 0.004 | 0.004 |
| HFPO-DA | Hexafluoropropylene oxide dimer acid (Gen-X) | 0.005 | 0.001 |
| PFHxS | Perfluorohexanesulfonic acid | 0.003 | 0.01 |
| PFNA | Perfluorononanoic acid | 0.004 | 0.01 |
Unregulated Sample Results – 2024
1,4-dioxane
Unregulated contaminants are those for which EPA has not established drinking water standards. The purpose of unregulated contaminant monitoring is to assist the EPA in determine the occurrence of unregulated contaminants in drinking water and whether future regulations are called for. Although, the EPA has not set a Maximum Contaminant Level for 1,4-dioxane, they have issued an advisory lifetime health goal of less than 35 ug/L for drinking water.
PWC meets or surpasses all the standard requirements annually. While 1,4-Dioxane has been detected in the Cape Fear River as well as other areas in our region, state and nation, the Environmental Protection Agency (EPA) currently has no standards for 1,4-Dioxane and has not yet issued regulated safe limits. If the EPA believed 1,4 Dioxane was an immediate threat, a directive would have been issued. Since 1,4-Dioxane cannot be removed through our traditional water treatment process, we have partnered with other communities to research and identify its sources to reduce or eliminate it so there will be no long-term exposure to our customers. You can find additional information on our website: www.faypwc.com/the-facts-about-1-4-dioxane/
| Sample Dates | P.O. Hoffer Point of Entry (ug/L) |
| 1/25/24 | BQL |
| 2/21/24 | 0.31 |
| 3/20/24 | 0.12 |
| 4/18/24 | BQL |
| 5/22/24 | BQL |
| 6/12/24 | BQL |
| 7/16/24 | BQL |
| 8/21/24 | BQL |
| 9/19/24 | BQL |
| 10/17/24 | BQL |
| 11/14/24 | 0.29 |
| 12/10/24 | 0.37 |
*BQL – Below Quantifiable Limit
Per- and Polyfluoroalkyl Substances (PFOA and PFOS)
Per- and polyfluoroalkyl substances (PFAS) are a group of man-made chemicals that have been in use since the 1940s and are (or have been) found in many consumer products like cookware, food packaging, and stain repellants. PFAS manufacturing and processing facilities, airports, and military installations that use firefighting foams are some of the main sources of PFAS. PFAS may be released into the air, soil, and water, including sources of drinking water. Perfluorooctanesulfonic acid (PFOA) and Perfluorooctanoic acid (PFOS) are the most studied PFAS chemicals and have been voluntarily phased out by industry, though they are still persistent in the environment.
Recent testing has detected PFOA and PFOS in Fayetteville’s drinking water. The table below shows our monitoring results for combined PFOS and PFOA at PWC’s water treatment Point of Entry (POE). POE refers to water that has undergone all treatment steps at the water treatment facilities, and is ready to be pumped to you, our customer.
EPA issues health advisories, which are based on the best available peer-reviewed studies about the health effects of the unregulated chemicals. Health advisories provide information on contaminants that can cause human health effects and are known or anticipated to occur in drinking water. EPA’s health advisories are non-enforceable and non-regulatory and provide technical information to states agencies and other public health officials on health effects, analytical methodologies, and treatment technologies associated with drinking water.
Fayetteville PWC is working to stay ahead of the science, as these substances continue to be measured at ever smaller concentrations. With modern laboratory methods, these substances can now be measured down to parts per trillion concentrations. For comparison, 1 part per trillion is approximately the equivalent of one drop of water in 10 million gallons of water. PWC reports the formal results of regulatory testing and unregulated contaminant monitoring in our annual Consumer Confidence Report, which provides an annual summary of water system operations and water quality management throughout the water system.
The EPA has updated its regulations, which will come into effect in 2029. These new rules will require that certain chemicals in water be kept at very low levels. Specifically, PFOA and PFOS must be kept at or below 4 parts per trillion (ppt). Additionally, when two or more of the chemicals PFNA, PFHxS, PFBS, and HFPO-DA (known as “GenX chemicals”) are found together, their combined level must not exceed a certain measure called the Hazard Index, which is set at 1.
Currently, PWC is monitoring the levels of 42 different chemicals quarterly (see charts below). Although some of these chemicals, like PFOS and PFOA, are not regulated yet, the EPA has set a Health Advisory level of 40 ppt for them. PWC is currently meeting these advisory levels and is preparing to comply with the stricter regulations of 4 ppt each, which will be enforced in 2029.
| Date | P.O. Hoffer Source Water PFOA RAA (ppt) | P.O. Hoffer Source Water PFOS RAA (ppt) | P.O. Hoffer Point of Entry PFOA RAA (ppt) | P.O. Hoffer Point of Entry PFOS RAA (ppt) | EPA Proposed MCL RAA (ppt) |
| 01/2024 | 6.10 | 10.72 | 6.09 | 10.79 | 4 |
| 04/2024 | 5.24 | 9.77 | 5.15 | 9.10 | 4 |
| 07/2024 | 6.19 | 11.03 | 6.18 | 10.58 | 4 |
| 10/2024 | 7.84 | 11.01 | 5.64 | 9.87 | 4 |
| Date | Glenville Lake Source Water PFOA RAA (ppt) | Glenville Lake Source Water PFOS RAA (ppt) | Glenville Lake Point of Entry PFOA RAA (ppt) | Glenville Lake Point of Entry PFOS RAA (ppt) | EPA Proposed MCL RAA (ppt) |
| 01/2024 | 5.69 | 17.35 | 5.62 | 17.80 | 4 |
| 04/2024 | 5.13 | 18.10 | 4.91 | 14.78 | 4 |
| 07/2024 | 5.79 | 19.48 | 5.38 | 13.13 | 4 |
| 10/2024 | 4.34 | 20.18 | 5.73 | 11.41 | 4 |
*This column refers to the updated rules from the EPA for chemical levels. Starting in 2029, the maximum level for PFOA and PFOS is set at 4 ppt each.
Total Trihalomethanes (TTHM) and Haloacetic Acids (HAA5)
| Disinfection Byproduct | Year Sampled | MCL Violation Y/N | Your Water (Highest LRAA) | Range Low High | MCLG | MCL | Likely Source of Contamination |
| TTHM (ppb) | 2024 | N | N/A | 80 | Byproduct of drinking water disinfection | ||
| B01 | 48 | 27 – 82 | |||||
| B02 | 43 | 27 – 69 | |||||
| B03 | 47 | 26 – 71 | |||||
| B04 | 48 | 27 – 83 | |||||
| B05 | 49 | 26 – 81 | |||||
| B06 | 47 | 28 – 69 | |||||
| B07 | 49 | 26 – 81 | |||||
| B08 | 46 | 26 – 80 | |||||
| HAA5 (ppb) | 2024 | N | N/A | 60 | Byproduct of drinking water disinfection | ||
| B01 | 29 | 20 – 47 | |||||
| B02 | 29 | 19 – 47 | |||||
| B03 | 31 | 18 – 54 | |||||
| B04 | 31 | 19 – 45 | |||||
| B05 | 29 | 17 – 51 | |||||
| B06 | 29 | 22 – 40 | |||||
| B07 | 27 | 18 – 42 | |||||
| B08 | 28 | 19 – 42 | |||||
Water Quality Resources
- Water Treatment Process
- PFAS Facts
- 1,4 Dioxane Facts
- Partnership for Safe Water
- Operation Clean & Clear
- Non-Detections Reported in Latest Lead Analysis
- Settlement Reached to Protect Cape Fear River Basin
- Interbasin Transfer Agreement Reached
- Don’t Flush Medicines
Annual Water Quality Reports
AWARDS & RECOGNITIONS
Partnership for Safe Water
- 24-Year Director’s Award
NC Waterworks Operators Association
- A-Surface Operator of the Year: Gary Thompson (2021), David Faircloth (2020), David Robinson (2018)
- C-Surface Operator of the Year: John Cummings (2023), DeQuante Moore (2021)
- Outstanding Operator of the Year: Delmer Coffman (2023), Chris Smith (2018)
- Educator of the Year: Jason Green (2023)
- Lifetime Member Award: Delmer Coffman (2022), David Robinson (2021), Gary Thompson (2021), James Gibson (2018), Chris Smith (2017)
- President’s Award: Chris Smith (2015)
NC Waterworks Operators Association – Southeast Section
- Thomas C. Flowers Award for Outstanding Service: Delmer Coffman (2022), Jason Green (2021), Chris Smith (2008)
NC One Water
- Golden Manhole Award: John Allen (2018)
- Best Tasting Water Competition: 3rd Place – Glenville Lake & P.O. Hoffer Water Treatment Facilities (2018); 1st Place – Glenville Lake & P.O. Hoffer Water Treatment Facilities (2005)
- Walter Courmon Safety Award: P.O. Hoffer & Glenville Lake Water Treatment Facilities (2015)
NC Department of Environmental Quality
- Area Wide Optimization Program Award:
- P.O. Hoffer Water Treatment Facility:2022, 2021, 2020, 2019, 2018, 2013, 2012, 2011
- Glenville Lake Water Treatment Facility: 2022, 2021, 2017, 2016, 2015, 2013, 2012
Cape Fear River Assembly J.W. Pate Award: Chad Ham (2016), Steve Blanchard (2009), Tim Wood (1991), Ray Muench (1989)